Summary tab
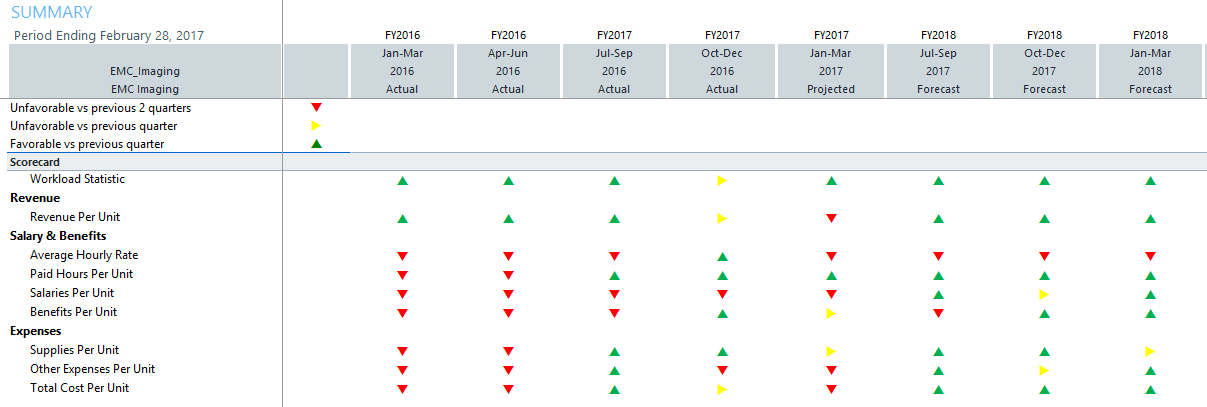
This tab compares the historical data and projections for each quarter and indicates whether each quarter's figures represent a favorable or unfavorable change from previous quarters.
The top portion of the tab is the scorecard section. The arrows indicate the following:
- Green arrow
 - Favorable performance vs. the previous quarter
 - Yellow arrow
 - Unfavorable performance vs. the previous quarter
 - Red arrow
 - Unfavorable performance vs. the previous two quarters
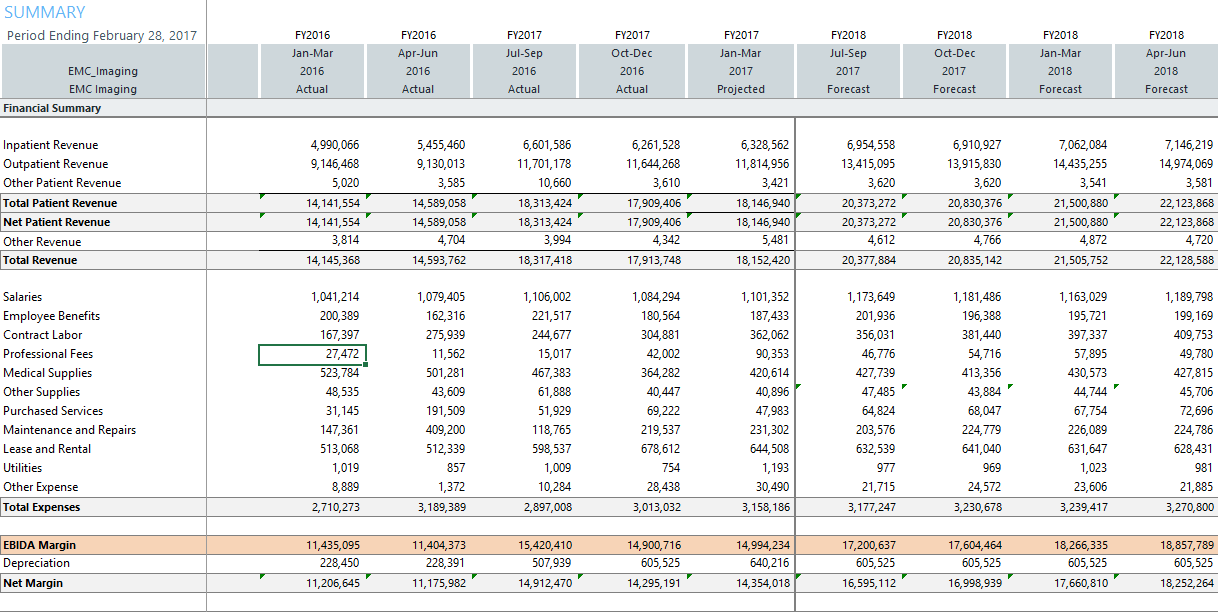
Forecast Summary section shows the P&L summary of the history and forecast results.
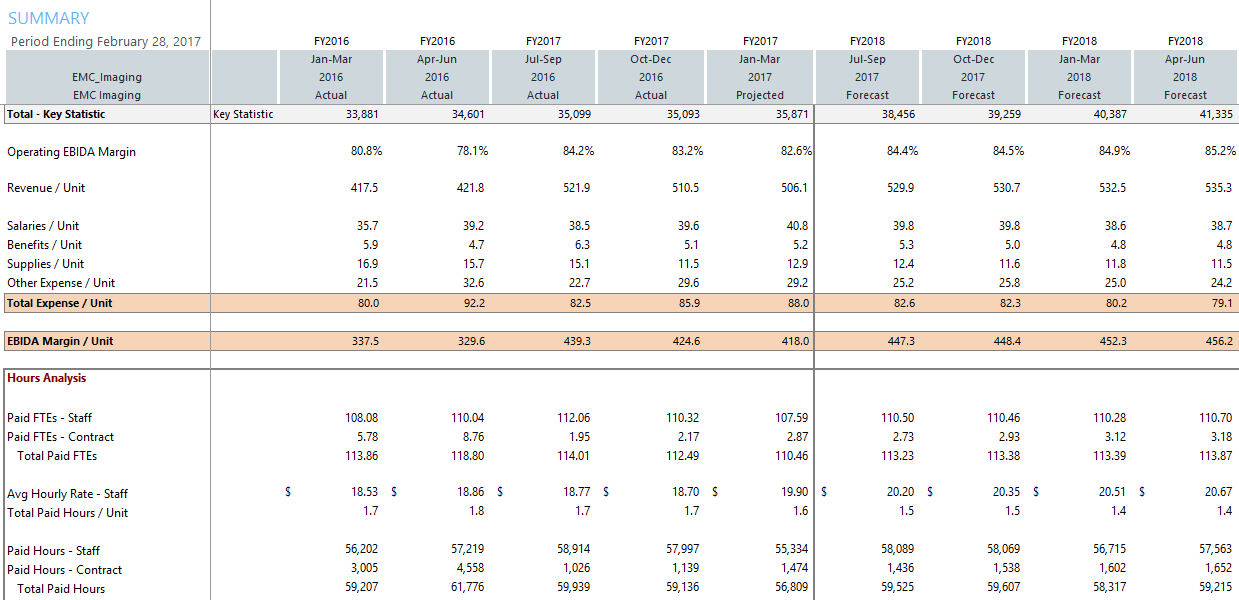
The Per Unit and Hours Analysis sections are a summary of the history and forecast results for each metric.